Cities and metro areas around the world are experiencing an uptick in economic inequality and Canada is not immune. Yet the country’s three largest metros remain substantially less divided than their U.S. counterparts.
Economic segregation—the separation of advantaged and disadvantage groups into separate enclaves—compounds this inequality, creating different levels of access to educational and economic resources for groups at the top, middle, and bottom of the economic ladder.
This Insight supplements the recently released Martin Prosperity Institute (MPI) report, Segregated City. It charts patterns of economic segregation for Canada’s three largest metros: Toronto, Vancouver, and Montreal, comparing their levels of economic segregation to that of U.S. metros. While most previous studies of economic segregation focused exclusively on income, this research develops detailed measures of income, educational, and occupational segregation, which are then combined in an index of Overall Economic Segregation.
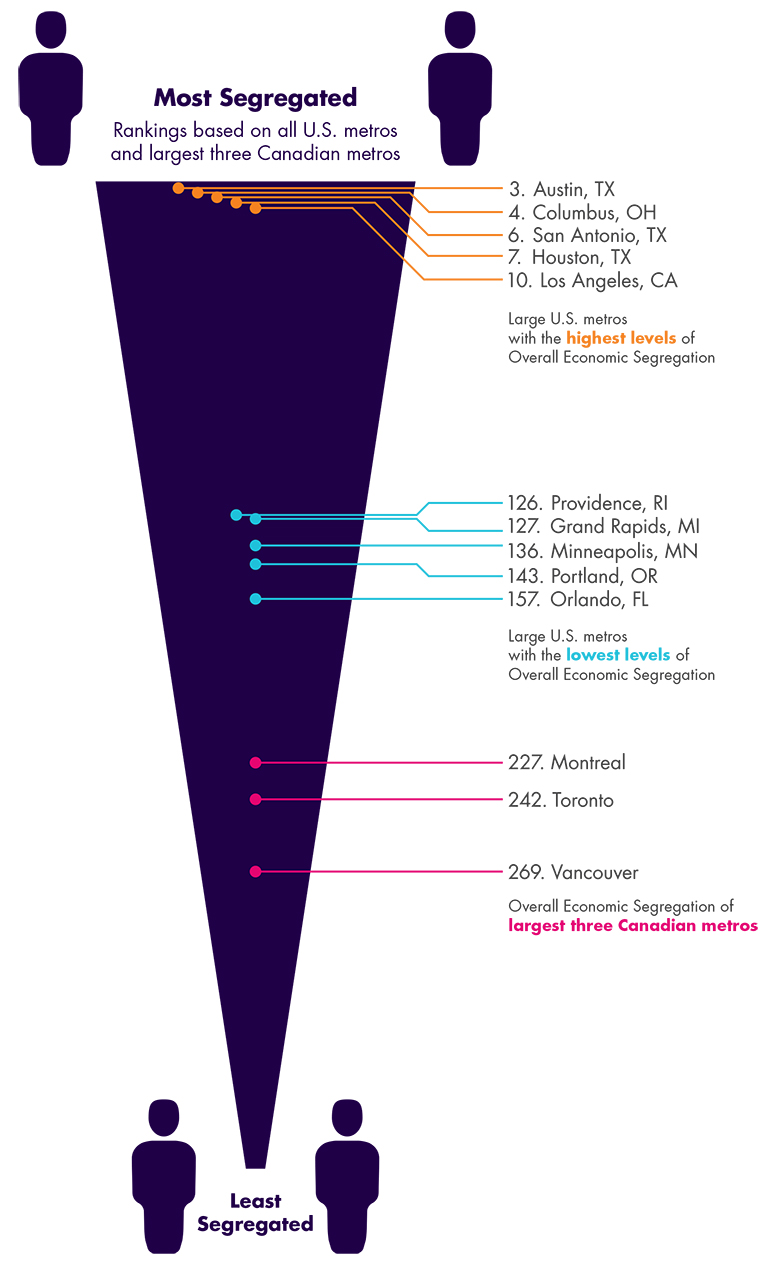
The graphic below illustrates how Toronto, Vancouver, and Montreal compare to all 350 plus U.S. metros on the Overall Economic Segregation Index.* The Segregation Index is based on a 0 to 1 scale where 0 reflects no segregation and 1 reflects complete segregation. Metros are ranked 1 to 362 (reflecting the 359 U.S. metros plus 3 Canadian metros) from most to least segregated.
With an Overall Economic Segregation Index of 0.41, Montreal is the most economically segregated metro of the three followed by Toronto at 0.37 and Vancouver at 0.32. These values are far below the segregation levels for America’s three largest metros: New York (0.89), Los Angeles (0.89), and Chicago (0.87).
Income Segregation: All three of Canada’s largest metros have substantially lower levels of income segregation than their U.S. counterparts: Montreal ranks 292nd, Toronto 336th, and Vancouver 360th. Income segregation measures the segregation of the wealthy versus the poor.
Educational Segregation: The pattern is similar, though slightly less pronounced, for educational segregation: Montreal ranks 194th, Toronto 232nd, and Vancouver 234th. Educational segregation measures the geographic separation of the highly educated (those with a bachelor’s degree and above) versus the less educated (those who did not complete high school).
Occupational Segregation: Again, the same basic pattern is present for occupational segregation. Toronto ranks 176th, Montreal 199th, and Vancouver 204th. Occupational segregation measures the segregation of the three major occupational classes: the creative class, the working class, and the service class.
Overall Economic Segregation: Ultimately, Canada’s three largest metros have significantly lower levels of economic segregation than their U.S. counterparts on our measure of Overall Economic Segregation (our combined measure of income, educational, and occupational segregation). All three rank in the bottom two-thirds of all North American metros: Montreal is 227th, Toronto 242nd, and Vancouver 269th. In fact, Canada’s three largest metros are substantially less segregated than the least segregated large U.S. metro, Orlando, which ranks 157th.
While it is true that Canada’s three largest metros are not as segregated economically as large U.S. metros, this does not mean that economic segregation is not a problem in Canada. Our own related research and that of our colleagues shows the growing socioeconomic divides that plague Canadian cities. Once noted as models of integration and social cohesion, Canada’s major cities and metro areas are increasingly divided by income and class as their middle class neighborhoods are hollowed out and their communities increasingly sorted into separate enclaves of rich and poor.
Download this Insight (PDF)