Rich or poor, the promise of social mobility always lay at the heart of the American Dream. But over the past two decades, many Americans have watched that dream slowly fade as the country becomes increasingly sorted by income, education, and class.
Segregated City, a new Martin Prosperity Institute study by Richard Florida and Charlotta Mellander, tracks the extent of economic segregation (the degree to which neighborhoods are made up of people of the same economic level) across America’s metropolitan areas. While most previous studies of economic segregation have focused exclusively on income, this study develops detailed measures of income, educational, and occupational segregation, which are then combined in an index of Overall Economic Segregation.
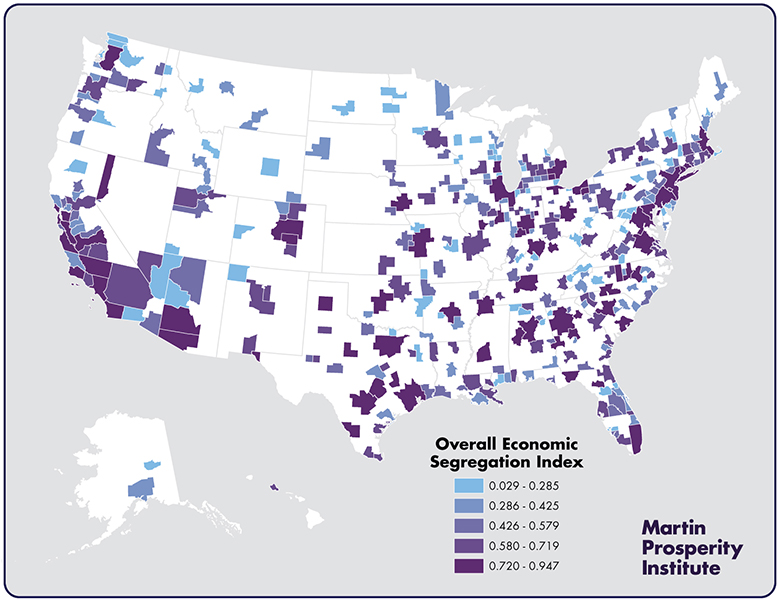
The map above charts overall economic segregation across the more than 70,000 Census Tracts that make up all 350 plus U.S. metros. The metros with the highest levels of segregation are shaded dark purple; blue indicates moderate levels of segregation; and light blue, lower levels of segregation. The table below shows the ten most and ten least segregated large metros in America (those with more than one million people).
Austin has the highest level of economic segregation of any large metro in the United States, and four of the ten most segregated large metros—it plus San Antonio, Houston, and Dallas—are in Texas. The nation’s three largest metros—New York, Los Angeles, and Chicago—also rank among the ten most segregated large metros, along with Philadelphia, Memphis, and Columbus, Ohio.
Large metros have higher levels of economic segregation than smaller ones. More than 200 small and medium-sized metros have lower levels of overall segregation than the least segregated large metro. All ten of the least segregated metros have populations of 300,000 or less. The most segregated small metros are mainly college towns.
Top 10 Large Metros with the Highest Levels of Overall Economic Segregation
| Rank | Large Metros with the Highest Segregation Levels | Index | Rank Out of All Metros |
|---|---|---|---|
| 1 | Austin-Round Rock, TX | 0.925 | 3 |
| 2 | Columbus, OH | 0.912 | 4 |
| 3 | San Antonio, TX | 0.903 | 6 |
| 4 | Houston-Sugar Land-Baytown, TX | 0.903 | 7 |
| 5 | Los Angeles-Long Beach-Santa Ana, CA | 0.893 | 10 |
| 6 | New York-Northern New Jersey-Long Island, NY-NJ-PA | 0.889 | 11 |
| 7 | Dallas-Fort Worth-Arlington, TX | 0.875 | 12 |
| 8 | Philadelphia-Camden-Wilmington, PA-NJ-DE-MD | 0.873 | 13 |
| 9 | Chicago-Naperville-Joliet, IL-IN-WI | 0.868 | 15 |
| 10 | Memphis, TN-MS-AR | 0.867 | 16 |
Top 10 Large Metros with the Lowest Levels of Overall Economic Segregation
| Rank | Large Metros with the Lowest Segregation Levels | Index | Rank Out of All Metros |
|---|---|---|---|
| 1 | Orlando-Kissimmee, FL | 0.548 | 203 |
| 2 | Portland-Vancouver-Beaverton, OR-WA | 0.581 | 217 |
| 3 | Minneapolis-St. Paul-Bloomington, MN-WI | 0.596 | 223 |
| 4 | Providence-New Bedford-Fall River, RI-MA | 0.611 | 233 |
| 5 | Virginia Beach-Norfolk-Newport News, VA-NC | 0.634 | 239 |
| 6 | Tampa-St. Petersburg-Clearwater, FL | 0.646 | 244 |
| 7 | Jacksonville, FL | 0.649 | 246 |
| 8 | Riverside-San Bernardino-Ontario, CA | 0.672 | 256 |
| 9 | Cincinnati-Middletown, OH-KY-IN | 0.673 | 259 |
| 10 | Hartford-West Hartford-East Hartford, CT | 0.674 | 260 |
The three types of segregation—income, educational, and occupational—are associated with one another. If a metro is segregated on one dimension, it increases the likelihood that it is segregated on the others. Of the three main types of segregation, income segregation is the most marked, followed by educational and occupational segregation.
Economic segregation is driven by the choices made by more advantaged groups. The creative class is more segregated than either the working class or service class. College grads are more segregated than those who did not finish high school. The wealthy are more segregated than the poor—indeed they are the most segregated of all groups, and by a considerable margin.
Economic segregation is associated with the following key economic and demographic characteristics of metros.
- Economic segregation is positively associated with population size and density. It is also positively correlated to two factors that follow from metro size and density: how people commute to work and the breakdown of liberal versus conservative voters.
- Economic segregation tends to be more intensive in high-tech, knowledge-based metros. It is positively correlated with high-tech industry, the creative class share of the workforce, and the share of college grads. On the other hand, a large working class seems to help stave off economic segregation; levels of unionization and the number of blue-collar workers are negatively associated with the phenomenon.
- Economic segregation is connected to the overall affluence of metros, with positive correlations to average metro wages, income, and economic output per capita.
- Race factors in as well. Economic segregation is positively associated with the share of the population that is black, Latino, or Asian, and negatively associated with the share that is white.
- Economic segregation is associated with in-come inequality and even more so with wage inequality. Its effects appear to compound those of economic inequality and may be more socially and economically deleterious than inequality alone.
Bill Bishop’s 2008 book, The Big Sort, described how high-skill, high-income people were concentrating more in some places than others. The big sort has now become an even bigger sort. America’s cities and metropolitan areas have cleaved into clusters of wealth, college education, and highly-paid knowledge-based occupations, juxtaposed to concentrations of poverty, low levels of education, and poorly-paid service occupations. This trend threatens to undermine the essential role that cities have played as incubators of innovation, creativity, and economic progress.
It is not just that the economic divide in America has grown wider; it’s that the rich and poor effectively occupy different worlds, even when they live in the same cities and metros.
Download this Insight (PDF)