In September, 2015 Toronto Life released their October issue including a ranking of Toronto’s best neighbourhoods. The Martin Prosperity Institute contributed to this article by collecting and compiling the data behind this ranking, as well as defining the methodology for scoring and ranking Toronto’s 140 neighbourhoods. Data was acquired from a number of sources including the City of Toronto, Statistics Canada, the Fraser Institute, the Toronto Police Service, and the Centre for Research on Inner City Health.
This ranking represents an update and evolution from a similar ranking released by Toronto Life in partnership with the Martin Prosperity Institute in August, 2013. The data and methodology were updated to further refine the ranking of neighbourhoods.
140 neighbourhoods were profiled in the ranking. The boundaries of these neighbourhoods were defined by the City of Toronto. These neighbourhoods are built from Statistics Canada Census Tracts, with each neighbourhood containing at least 2 census tracts. A full methodology on how the City of Toronto defined these neighbourhoods can be found here.
The data behind this report fits into 10 categories: Crime, Transit, Health, Community, Diversity, Housing, Employment, Entertainment, Schools, and Shopping. Each neighbourhood was scored, and then ranked, in each of these 10 categories. These rankings were then compiled into one large overall ranking. In all cases excepting the Schools category, multiple variables contributed to each category ranking. These variables are as follows:
Crime: We included statistics on number of assaults, sexual assaults, break & enters, robberies, vehicle thefts, murders, and arsons. These numbers were sourced from Wellbeing Toronto’s 2011 data.
Transit: Two variables were used to score neighbourhoods on transit: number of stops (including bus, streetcar, and non-subway stops) per square kilometre and a ranking based on how many Overcrowded Routes there were in each neighbourhood. These numbers were sourced from Wellbeing Toronto’s 2011 and 2008 data respectively.
Health: Two sets of variables were examined in the health category. Firstly, we included variables reflecting the health of the population. This includes diabetes prevalence, percent incidence of colorectal screenings, and percent incidence of breast cancer screenings. These variables are controlled for population. In addition, variables related to environment were collected. These include tree cover per square kilometre, green space per square kilometre, and amount of pollutants released to air. This data was sourced from Wellbeing Toronto’s 2011 data.
Housing: We collected a benchmark housing price average and income data from Market Watch and Statistics Canada. We used this data to calculate an affordability index. This was calculated by a ratio of average income to average housing price. Also included in the housing category are year over year % change (from Market Watch) as well as percent of housing needing major repairs (2011 NHS, Statistics Canada).
Shopping: Several types of shopping were examined as a proxy for retail in each neighbourhood. Number of grocery stores per square kilometre, number of hardware stores per square kilometre, and number of drug stores per square kilometre were combined to provide a score for shopping in each neighbourhood. This data was acquired from Statistics Canada and Dun & Bradstreet.
Community: Two variables were examined to calculate a community score for each neighbourhood. Firstly, percent voter turnout (2006 election). Secondly, city beautification initiatives per kilometre. This data was sourced from Wellbeing Toronto as calculated by the City of Toronto.
Schools: We used the Fraser Institute’s 2013–2014 ranking for both primary and secondary schools. Schools were averaged across each neighbourhood.
Diversity: Diversity measures include percent visible minority population, economic inequality (Gini coefficient), and the city’s own diversity index. The data at the neighbourhood level is from Wellbeing Toronto.
Entertainment: Several types of entertainment were considered for this category. First, the Cultural Location Index was used. This index measures the cultural economy within a city, including percent of cultural workers and number of cultural facilities in each neighbourhood. Secondly, amount of community and sports facilities per square kilometre were considered. These data were acquired from Wellbeing Toronto. Lastly, number of bars, cafes, and restaurants per square kilometre was considered. This data comes from Dun & Bradstreet.
Employment: Percent unemployed, number of businesses per square kilometre (within the neighbourhood’s boundaries), and local employment per capita were combined in the employment indicator. This data was acquired from Wellbeing Toronto.
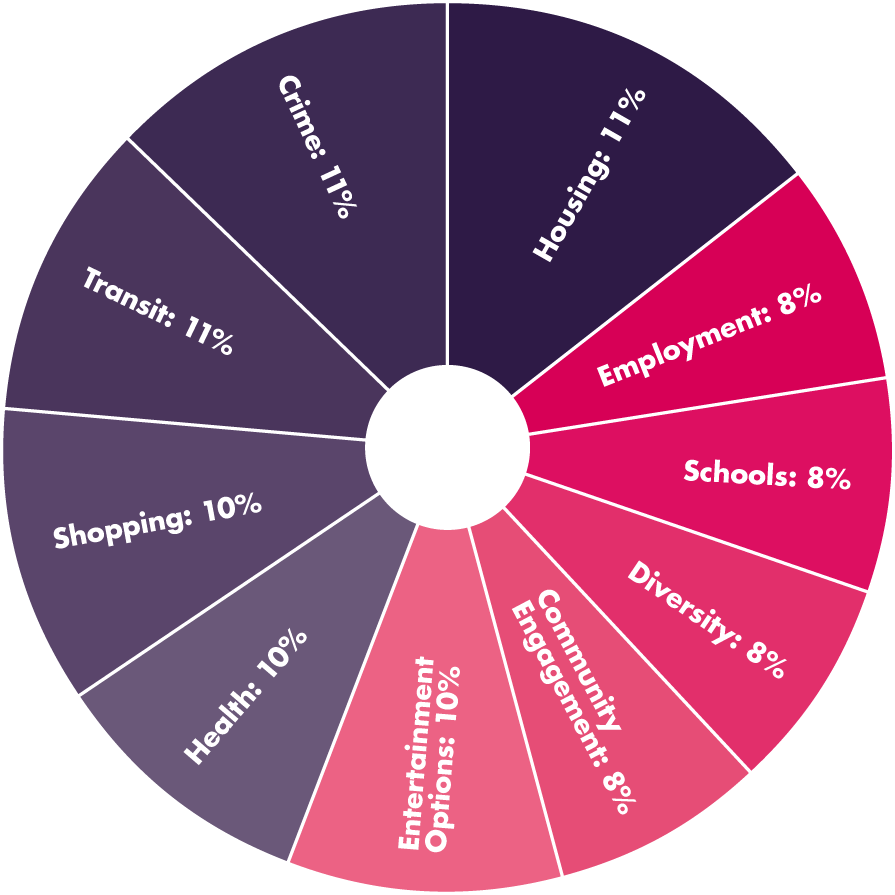
These ten variables were then weighted based on a survey of Toronto Life’s readers. Variables were weighted on priorities of survey respondents. Housing is weighted highest, at 15 percent of the overall score. Housing is followed by Crime (13 percent), Transit (11 percent), Shopping (11 percent), Health (10 percent), and entertainment (10 percent). The remainder of the top 10 is rounded out by Community (8 percent), diversity (8 percent), schools (7 percent), and employment (7 percent). The ten categories are then combined to create an overall score for each neighbourhood. These overall scores determined the final ranking of Toronto neighbourhoods.